 Burn
Get Burn
Burn
Get Burn
Burn
Get Burn
Burn
Get Burn
HOME / FEATURES / WEIGHT TRACKING
Burn plots your raw weigh-ins and a seven day average on the same chart. The raw line jumps around. The average is the one that tells you which direction you are going.
Weight moves with fluid, food volume, salt and the time of day. Reading a single morning as progress is how people talk themselves out of a plan that is working.
7-day
Short-term direction
30-day
The one worth judging on
All-time
Since your first entry
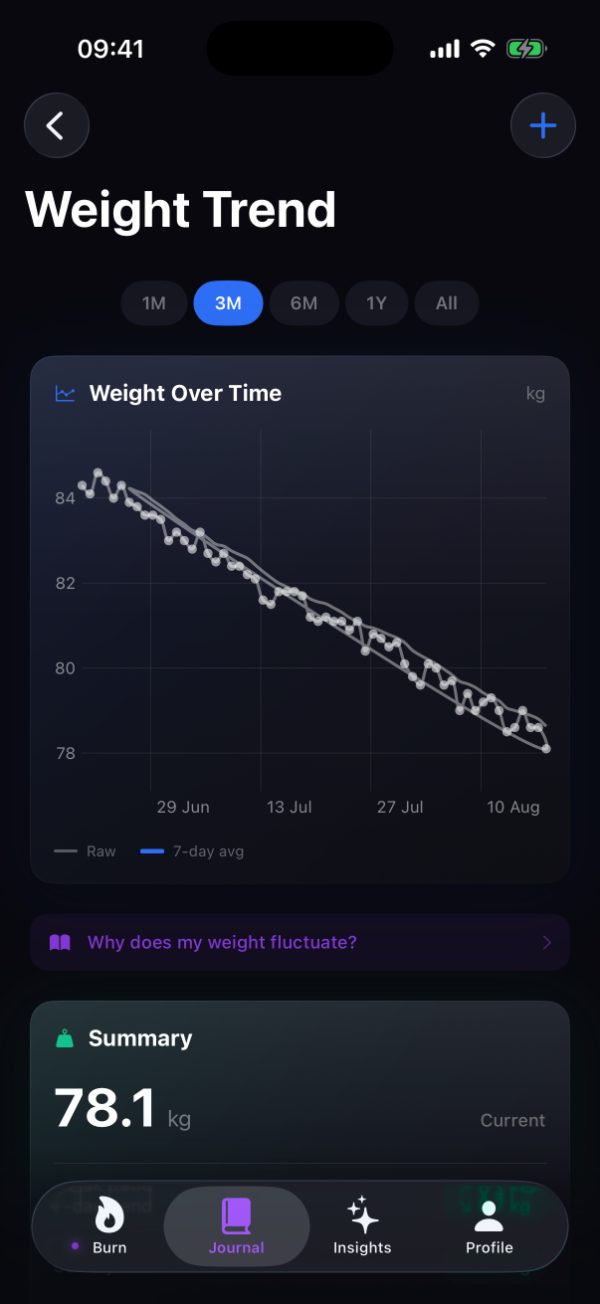
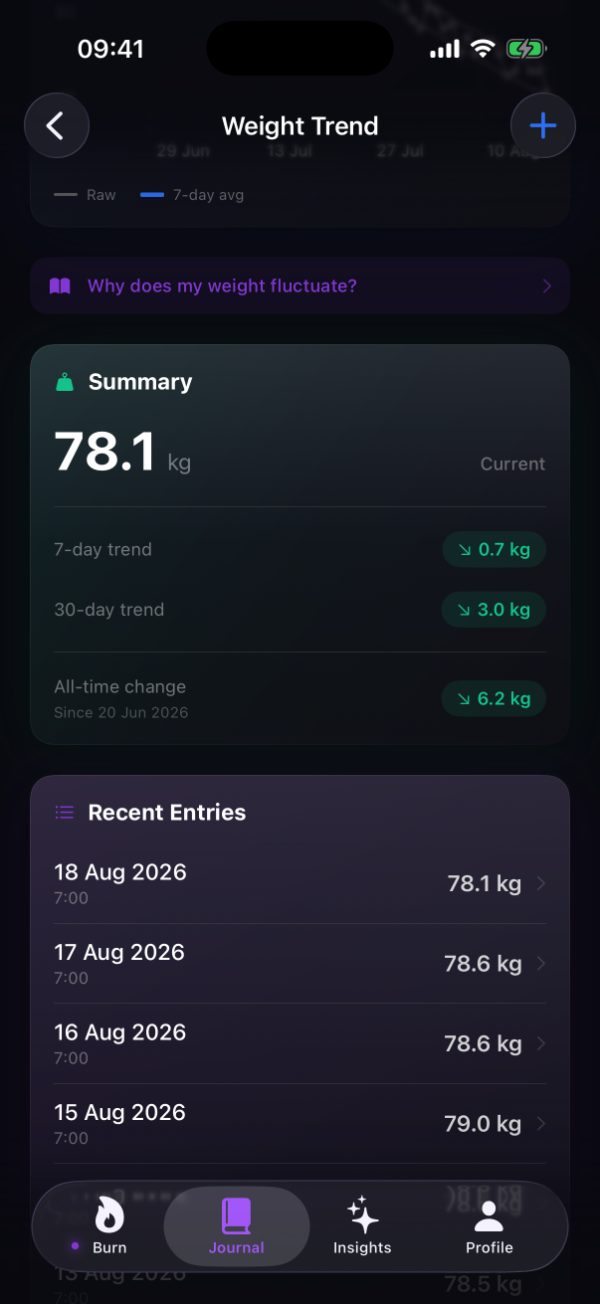
The summary
Your current weight sits at the top, then the same movement measured over three windows. When the seven day figure disagrees with the thirty day figure, the thirty day one is the one to trust.
Noisy by nature. Useful for spotting a stall, not for judging a week.
Long enough that fluid shifts average out. This is the number that answers whether the plan is working.
Dated from your first entry, so the figure means something specific rather than being a running total.
The figures above are the ones shown in Burn's Weight Trend summary.
Why the average matters
Same time, four days in a row, and 0.9 kg down across them. Progress arrived unevenly: a drop, two identical mornings, then another drop.
15 AUG, 7:00
79.0 kg
16 AUG, 7:00
78.6 kg
17 AUG, 7:00
78.6 kg
18 AUG, 7:00
78.1 kg
A day with no movement is not a day with no progress. Glycogen is stored with water, and lower insulin during a fast means your kidneys release sodium and fluid, so the scale can hold still or rise while fat is coming off underneath.
Logging it
Same time, same conditions, and the average does the rest.
WHEN
Every entry in the screen above is logged at 7:00. Keeping the time consistent removes one source of daily variation before it reaches the chart.
RECENT ENTRIES
The most recent entries sit under the summary with their dates and times, and each one opens for a closer look.
ALONGSIDE THE FASTS
Weight sits with your fasts, water, electrolytes and check-ins, so a month of consistency and a month of movement are visible on the same record.
A scale cannot separate fat from fluid or muscle, and Burn does not claim to either. It records what you enter and shows you the direction over time. That the link between lower insulin, sodium excretion and fluid loss during fasting produces early scale movement is drawn from peer-reviewed research and traced in our evidence policy.
Daily weighing does not suit everyone. Burn works without a single weight entry. The weight-derived record simply stays unset, and the timer, stages and history are the same either way. Speak to a doctor before fasting if you have a history of eating disorders.
Burn plots the raw entries and the seven day average together, with the movement measured over three timeframes.
Download free on the App StoreiPhone, iPad, and Apple Watch. Requires iOS 18 or watchOS 11.